Abstract
Aeolus models a thirty-turbine offshore field on the Jensen wake model, the analytical standard the wind industry has used for decades to estimate how much energy a given layout will produce.
Each turbine pulls energy from the wind and trails a slower, disturbed wake; machines sitting in that deficit generate less. Aeolus computes those wakes and their overlap across the full array in one continuous pass, so the efficiency figures, the per-turbine output and the field’s response to wind direction are all products of the model as it runs.
The model demonstrates that a working engineering model can drive an interactive twin at realistic array scale, in a browser, at a frame rate that lets a user rearrange the turbine field and observe the outcome in real-time.
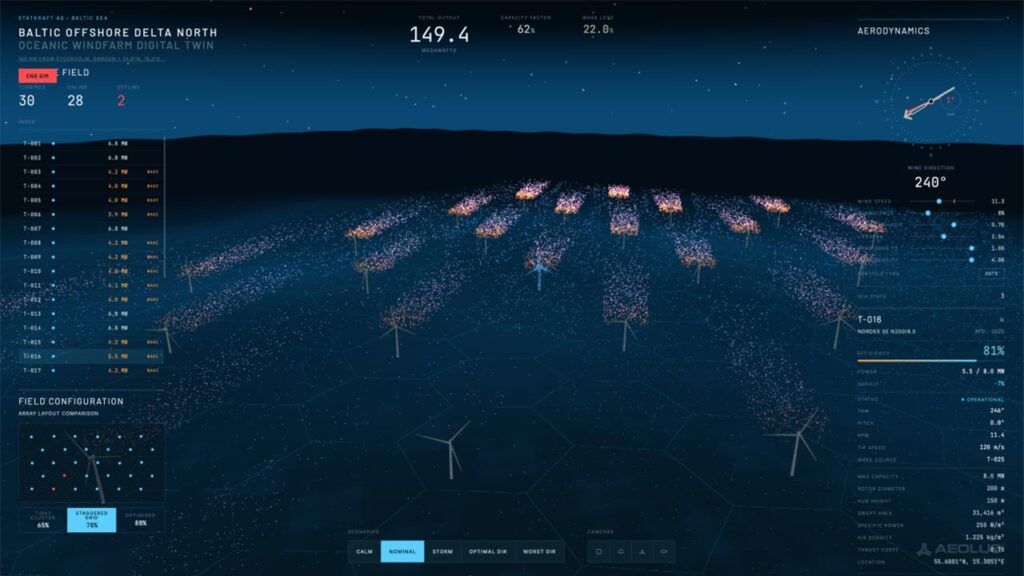
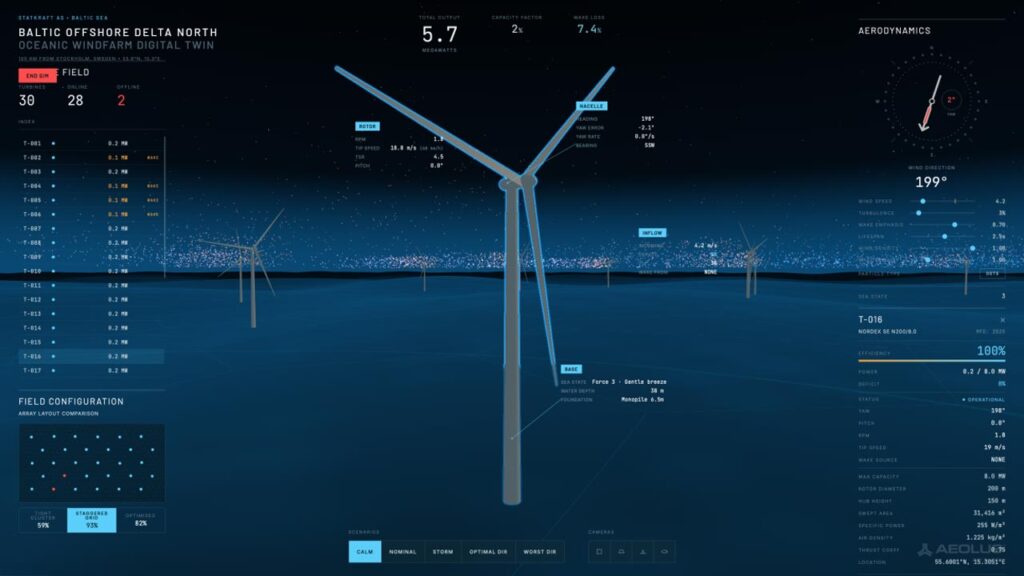
Fig 1. Aeolus calculates Jensen wake deficits behind each individual turbine; wake superposition, so downstream machines sit in the combined deficit of everything upwind; per-turbine output against incident wind speed; and array efficiency across the full wind rose.
Fig 2. Selecting a turbine resolves the field view down to one machine and exposes the state behind its contribution: rotor speed and tip speed, nacelle heading against the incoming wind and the yaw error between them, inflow velocity at the rotor plane, and the wake source upwind – none, here, so T-016 sees clean air and runs at full efficiency.
Features
Everything in the field view is downstream of one decision: solve the wake model continuously rather than precompute states. Each capability alongside is a consequence of that architecture: the interactivity and the physics are the same system, so anything the model can answer, the interface can ask.
| Capability | What it demonstrates |
| Jensen wake physics, computed live | Every figure on screen comes from the model as it solves. Move a turbine and the arithmetic behind the efficiency number runs again. |
| Layout comparison with efficiency deltas | Array losses recompute as the field is rearranged — the question layout engineers spend their time on, made interactive. |
| Wake superposition across the full array | Downstream turbines sit in the combined deficit of everything upwind, which is how an array behaves at scale. |
| Efficiency-by-direction rose | Yield plotted as a curve against wind direction, showing how much of the answer depends on where the wind comes from. |
| Thirty turbines in a continuous solve | The full field resolves fast enough to stay interactive at a realistic array size. |
| Single self-contained file | Runs on ordinary web tech with no backend, install or network. The entire demonstration is one file. |
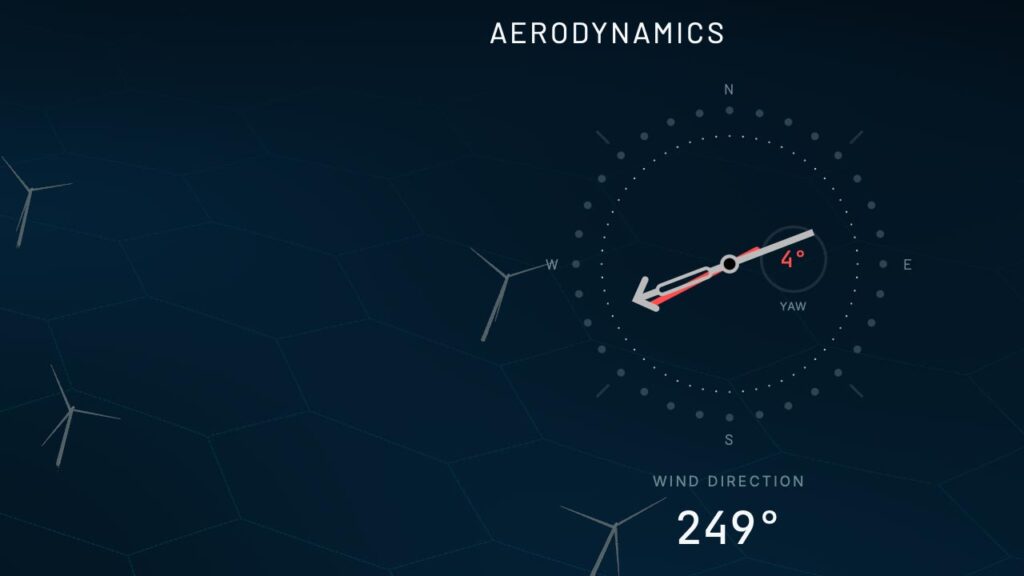
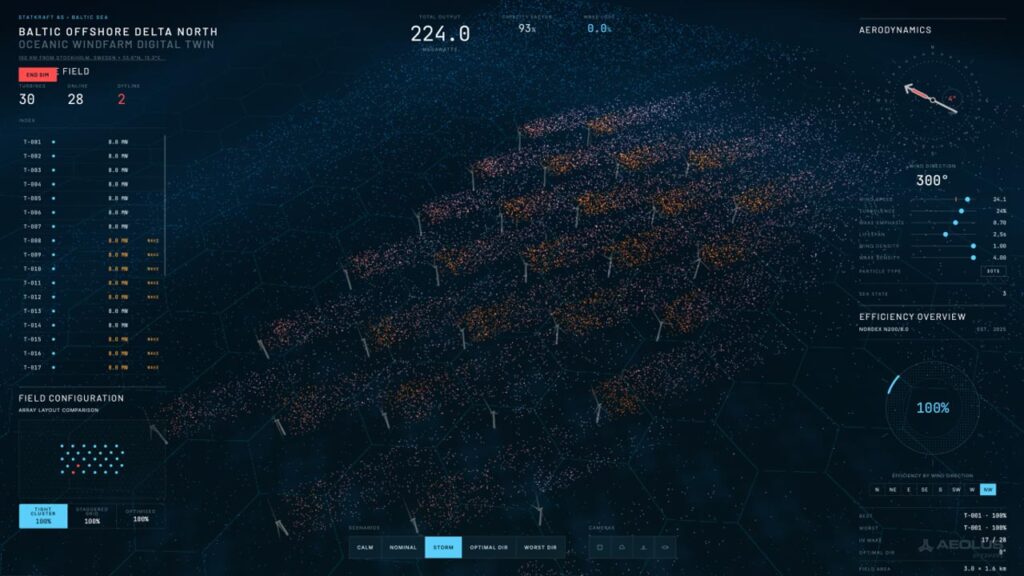
Fig 3. The aerodynamics panel resolves to wind direction and the machine’s response to it: inflow at 249°, the rotor tracking it with 4° of yaw error. The turbine turns to face the wind, yaw control follows in steps, and the residual is a standing cost paid across the whole field.
Fig 4. Storm conditions at 300°, with the array at 224 MW and wake loss at zero. Above rated wind speed every machine reaches its ceiling whether it sits in clean air or in the deficit of the rows upwind, so the layout comparison flattens to 100% across all three configurations. Wake losses are a problem of moderate wind, which is where most of the year’s energy is produced.
Conclusion
This architecture can ingest actual site data – measured wind conditions from the met mast, actual turbine specifications and power curves, real coordinates and water depths – and deliver an interrogable field that answers valuable questions: how array configurations bleed wake, which rows carry the deficit under certain conditions, what a repositioned turbine would recover, and what a machine coming offline costs the field around it.
These are questions with real-world monetary value attached, and simulating them early in a project’s lifecycle can unlock enormous cost-savings later.
Get In Touch
Ready to accelerate your transformation? Let’s start a conversation.