Abstract
Tens of thousands of guests arrive from different directions. Parking areas fill. Gates process thousands of entries per hour. Concourses become congested. Restroom and concession demand changes throughout the event. Security teams, medical personnel, facilities staff, cameras, communications systems, venue operators: all respond to conditions that change by the minute.
Williams-Brice Stadium Intelligence was built to explore how those activities could be understood through a common spatial interface.
This prototype connects operational information directly to the physical areas it affects. Instead of seeing only that a gate has a long wait, an incident has been reported, or a section has elevated density, an operator can see where it is occurring, what surrounds it, which resources are nearby, and what action may be appropriate.
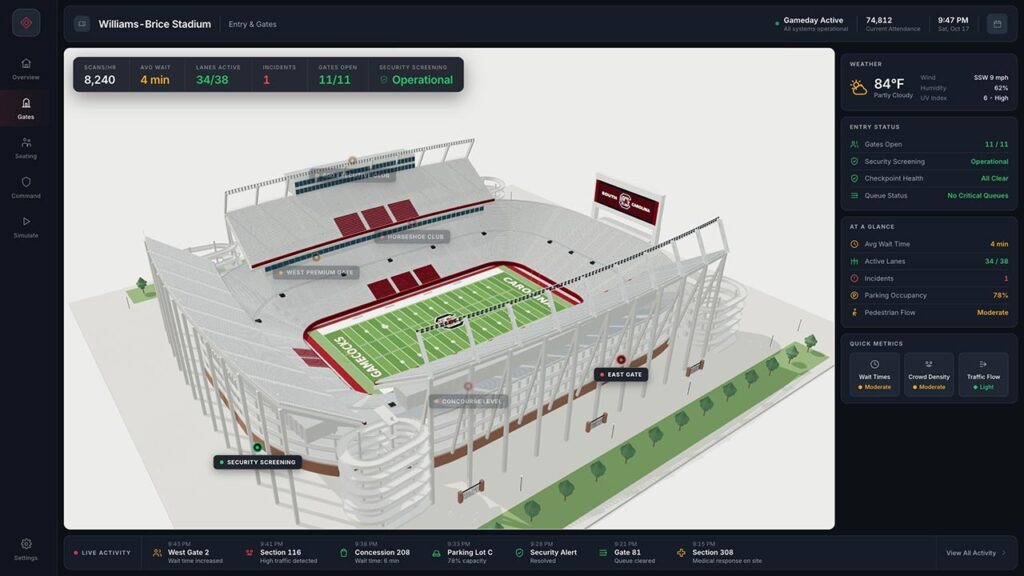
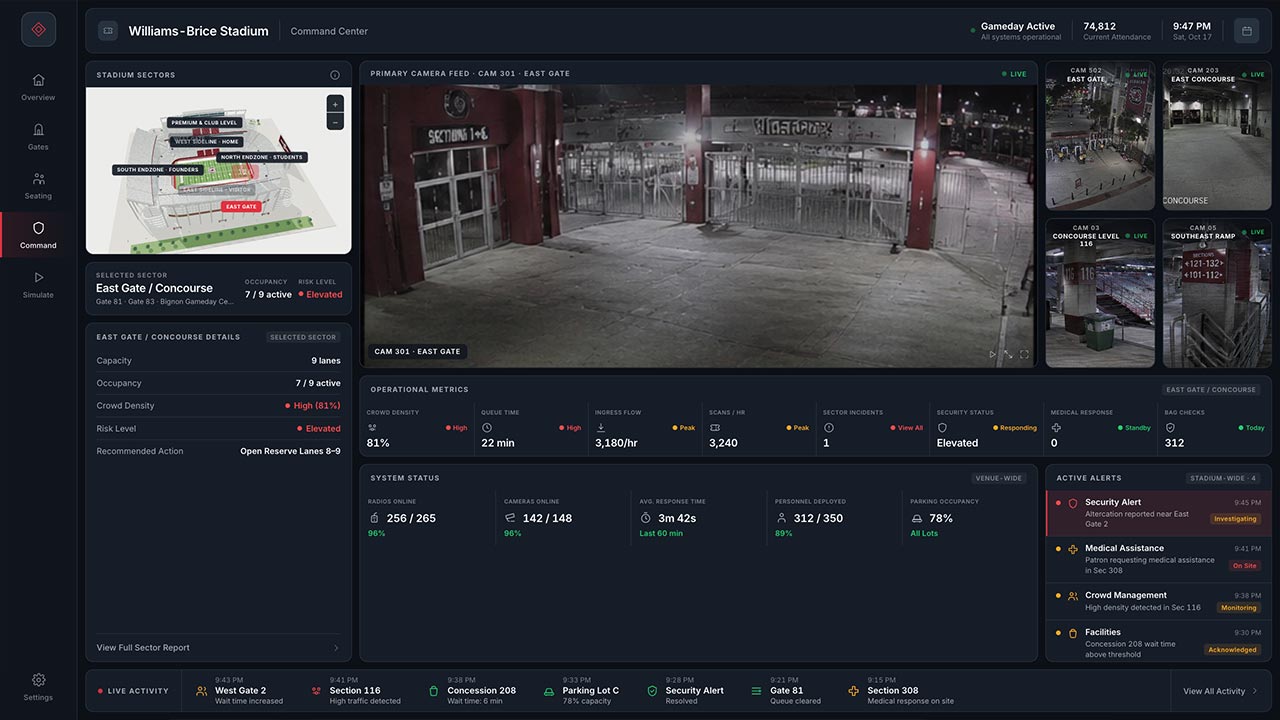
Fig 1. A three-dimensional model of Williams-Brice Stadium provides the spatial foundation for the system. Attendance, venue occupancy, gate status, parking, weather, wait times, crowd density, traffic flow, advisories, and system health can be understood alongside the physical areas they affect.
Fig 2. The gate view resolves the venue down to individual entry conditions. Scan rates, active screening lanes, queue times, pedestrian flow, ADA access, incidents, and parking conditions can be compared across entrances. At the East Gate, the prototype identifies an elevated queue and available reserve lanes, demonstrating how operational information can move from observation toward action.
Features
The system is built around a simple principle: the stadium itself becomes the interface for understanding the information generated in and around it.
Moving from the venue overview into a gate, seating zone, command sector, or simulated incident reveals progressively more specific information while preserving its relationship to the physical stadium.
| Capability | What it demonstrates |
| Unified Venue Overview | Brings occupancy, advisories, parking, weather, waits, crowd conditions, traffic, and system health into one stadium-wide operating picture. |
| Gate & Ingress Intelligence | Compares scan rates, queue times, active lanes, screening, pedestrian flow, ADA access and gate conditions to identify where intervention may be useful. |
| Seating & Guest Experience | Connects seating zones with occupancy, density, concourse use, restroom and concession waits, medical activity, and premium-space utilization. |
| Spatial Command Environment | Selecting a stadium sector updates its risk level, metrics, camera feeds, incidents, and recommended action together. |
| Safety & Security Context | Walks operators through a structured Detect → Investigate → Assess → Respond → Review process for simulated incidents. |
| Scenario Simulation | Usage and performance reporting structured for USDA-NRCS requirements. |
| Parking & Event Mobility | Incorporates parking occupancy, pedestrian flow, vehicle conditions, and traffic status as the foundation for broader arrival and departure planning. |
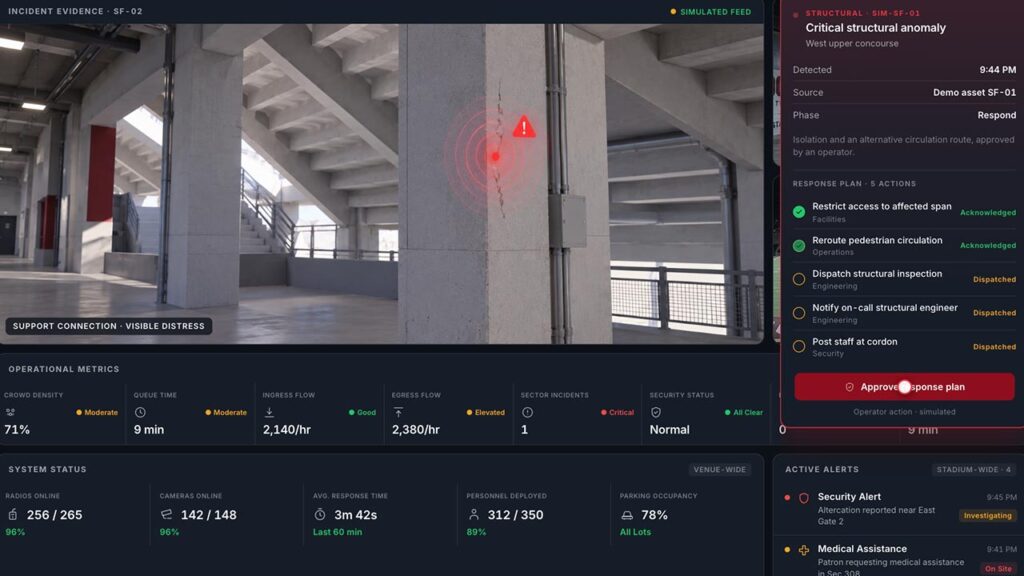
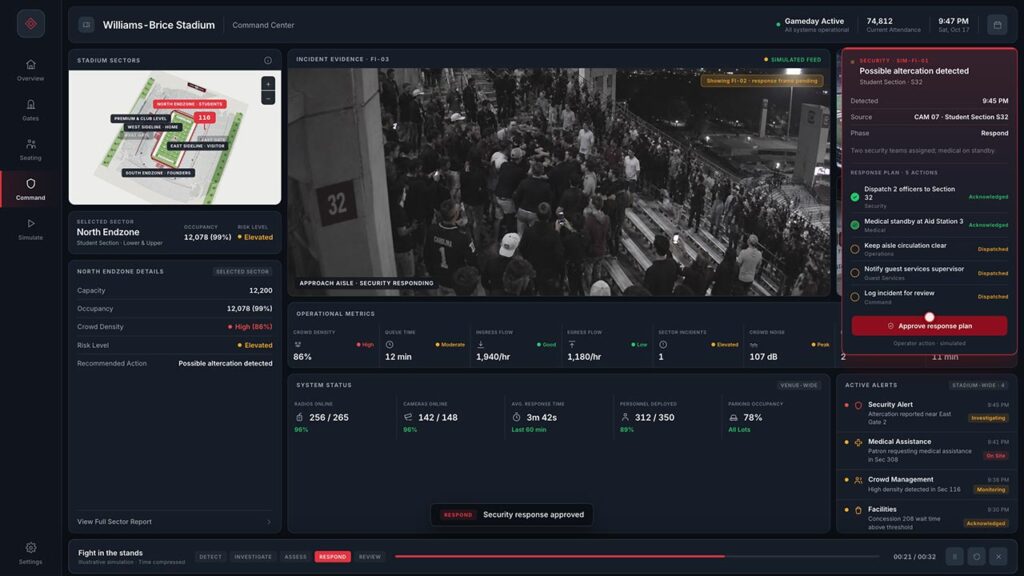
Fig 3. The Command environment demonstrates how one area of the stadium can be understood across multiple systems at once. Selecting a sector brings together crowd density, queue conditions, ingress and egress flow, incidents, security posture, medical response, camera coverage, personnel, and a recommended operational action.
Fig 4. The simulation environment tests how operators could move from detection to response within the same system.
In the security scenario, a possible disturbance is identified, verified through camera evidence, assessed against nearby crowd and response conditions, and escalated into a coordinated security and medical response.
Conclusion
Williams-Brice Stadium Intelligence demonstrates a different way to think about a digital twin. Beyond simply reproducing a stadium in three dimensions, the model provides a shared environment through which the venue can be understood, operated, simulated and improved.
The architecture can also extend beyond the stadium. Parking assignments, pedestrian routes, outbound road configurations, and traffic-control strategies could be simulated to understand how different departure plans affect the surrounding network.
The result is not simply a digital representation of Williams-Brice Stadium. It is a framework for understanding how a major venue behaves when thousands of individual journeys, operational decisions, and physical systems interact at the same time.
Get In Touch
Ready to accelerate your transformation? Let’s start a conversation.